Four Runs, Same Wrong Number: What Context Actually Buys a Coding Agent
August 1, 2026
If you only read one section, read Learnings.
The setup: a headless Claude Code agent (claude -p) ran six real tasks from my two shipping products, both running PostHog in production, under four context regimes, on two models (claude-sonnet-5 and claude-opus-5). Every pass/fail was decided by a script against a pinned reference. No LLM judge anywhere.
Getting to numbers I trust took four grids and 296 scored trials, plus cap-sweep batches, because along the way I had to catch and fix three problems in my own harness: a turn cap that was starving the coding tasks, a checker with bugs in both directions, and a rate-limit failure mode that scored empty runs as real failures. This report is the whole arc, findings and corrections together.
TL;DR:
- Live data access via MCP is the only regime that ever solved the analytics tasks. Every analytics pass in every grid, on both models, came under
mcp. Documentation alone, however good, went zero for everything there. - The sharpest finding is an MCP failure: run after run computed the identical wrong funnel number by the identical shortcut. It reproduces most of the time, so there is a locatable doc fix behind it rather than a model quirk.
- The 50-turn cap in my first grid decided the coding tasks for me: 39 of 40 addressable failures at the cap were turn starvation. Uncapped, the hardest coding task saturated to 8/8 for both models, and an apparent “curated context wins” effect turned out to mean “curated context is cheaper, not smarter.”
llms.txt, PostHog’s own agent-facing doc index, bought zero lift over no context at all, at 2.9x the cost per run.- I audited my own scoring code mid-study, found bugs in both directions, and caught a rate-limit bug that had silently poisoned 55 rows. Every correction is traceable in the public run journals.
The goal
Answer one question with data: which kind of context actually helps a coding agent get PostHog tasks right, and which kind just burns tokens? The credible way to test that is to stop asking “is the documentation good” and start asking “does an agent that only has this documentation get the task right,” scored by a program, not a read-through.
So every task here is something I actually needed done on my own products: Card Harbor, an Electron/TypeScript desktop app, and Keeplings, a Flutter app with PostHog live in production.
Method
Tasks. Six, in two families. The ch- coding tasks run against a pinned Card Harbor commit, authored before the real feature landed. The kp- analytics tasks run against Keeplings production data.
| Task | Family | What the agent must do |
|---|---|---|
ch-release-tagging |
Coding | Tag events with app version/build as super properties, sourced from the packaged app |
ch-main-process-capture |
Coding | Capture Electron main-process crashes; only the renderer has a PostHog client today |
ch-flag-gated-rollout |
Coding | Gate an unattended automation step behind a feature flag, defaulting safely to off |
kp-release-impact |
Analytics | Event volume and DAU, 7 days before vs. after a release |
kp-reminder-funnel |
Analytics | Per-user conversion from reminder_created to a subsequent habit_confirmed |
kp-store-engagement |
Analytics | Fraction of store visitors who also earned amber, and their median amber-earned count |
Scoring. All scripted, no LLM judge:
ch-tasks: typecheck, a diff scan for the right PostHog calls in the right files, and a hallucinated-SDK scan against the installedposthog-js/@posthog/reactversions.kp-tasks: the agent writes its answer and the HogQL it ran toanswer.json; a checker compares both against a verified reference query within a stated tolerance.- Harness-side faults: a reserved
check-infracode, excluded from pass rates.
Regimes. Four conditions, identical prompt otherwise:
| Regime | What the agent gets |
|---|---|
none |
Task prompt only. WebSearch and WebFetch both off. |
llms-txt |
A frozen snapshot of posthog.com/llms.txt (a ~330 KB link index of doc URLs; llms-full.txt 404s) injected into context, plus WebFetch scoped to posthog.com, since following the index’s links is its designed use. |
mcp |
The live PostHog MCP server (https://mcp.posthog.com/mcp), bearer-authenticated with a read-only, project-pinned personal API key. No doc injection. |
bundle |
A hand-authored, task-scoped context bundle built only from public PostHog docs, content-hashed and frozen before its first scored run. |
WebSearch, Task, and Agent are disallowed in every regime, so every run stays single-agent and off the open web beyond the one scoped exception above.
Grids. The study ran as a sequence, each grid motivated by what the previous one exposed:
- Cap-50 sonnet grid: 96 trials (n=4 per cell, as two independent 48-trial batches),
max_turns: 50. The original measurement. - Cap-50 opus arm: a matching 96-trial opus grid, which is what exposed the checker bugs below.
- Checker-fix rerun: 8 opus trials of the affected task under the corrected checker, still at cap 50.
- Definitive grid: 96 trials, both models, all six tasks, all four regimes, n=2 per cell,
max_turns: 1000with a 5400-second wall-clock backstop, fixed checks. Plus cap-sweep batches at 100 turns that justified removing the cap.
Two pre-publication batches are excluded entirely: one ran before the regimes were fully wired, and one had two harness gaps (headless MCP silently not connecting, and the agent subprocess inheriting live credentials). Both fixes are covered under “Methods hardening.”
Caveats up front:
ch-runs use a real Card Harbor checkout, so the repo’s ownCLAUDE.md/AGENTS.mdreach the agent even innone. That leakage is identical across regimes, so comparisons hold, butnoneis a repo-context baseline on those tasks, not a zero-context one.- n=4 (and n=2 in the definitive grid) is enough to find floors, ceilings, and directions. It is not enough to call a mid-range difference significant: distinguishing a 90% pass rate from 80% at conventional power needs roughly 100 trials per cell.
Results: the definitive grid
The grid I stand behind: 1000-turn cap, both models, fixed checks.
| Model | Passes | Pass rate |
|---|---|---|
| sonnet | 22/48 | 46% |
| opus | 23/48 | 48% |
By regime (of 12 per model):
| Regime | Sonnet | Opus |
|---|---|---|
| mcp | 8 | 7 |
| llms-txt | 5 | 5 |
| none | 5 | 5 |
| bundle | 4 | 6 |
By task (of 8 per model; each cell is two trials per regime, in regime order none, llms-txt, mcp, bundle, P/f per trial):
| Task | Sonnet | Opus |
|---|---|---|
| ch-main-process-capture | PP PP PP PP (8/8) | PP PP PP PP (8/8) |
| ch-release-tagging | PP PP Pf fP (6/8) | PP PP ff PP (6/8) |
| ch-flag-gated-rollout | Pf Pf ff Pf (3/8) | fP Pf Pf PP (5/8) |
| kp-release-impact | ff ff PP ff (2/8) | ff ff PP ff (2/8) |
| kp-store-engagement | ff ff PP ff (2/8) | ff ff PP ff (2/8) |
| kp-reminder-funnel | ff ff Pf ff (1/8) | ff ff ff ff (0/8) |
Zero rows hit the turn cap: ch- runs ranged 22 to 122 turns, averaging 77.3 across both models. Every kp- pass in this grid, all nine of them across all three analytics tasks and both models, came under mcp. The mid-range regime gaps in the tables are below what n=2 can adjudicate; the floors, ceilings, and the mcp-only analytics column are not.
How the first grid lied, and how I caught it
The original cap-50 sonnet grid is worth reporting in full, both because parts of it hold up and because the ways it misled are the most transferable lessons in this study.
Pass/fail grid (P = pass, f = fail, four trials per cell, in trial order):
| Task | none | llms-txt | mcp | bundle |
|---|---|---|---|---|
| ch-release-tagging | PPPP | PPPP | PPPP | PPPP |
| ch-main-process-capture | fPfP | ffPf | ffff | PPPP |
| ch-flag-gated-rollout | ffff | ffPf | fffP | fPff |
| kp-release-impact | ffff | ffff | PPPf | ffff |
| kp-reminder-funnel | ffff | ffff | ffff | ffff |
| kp-store-engagement | ffff | ffff | PPPP | ffff |
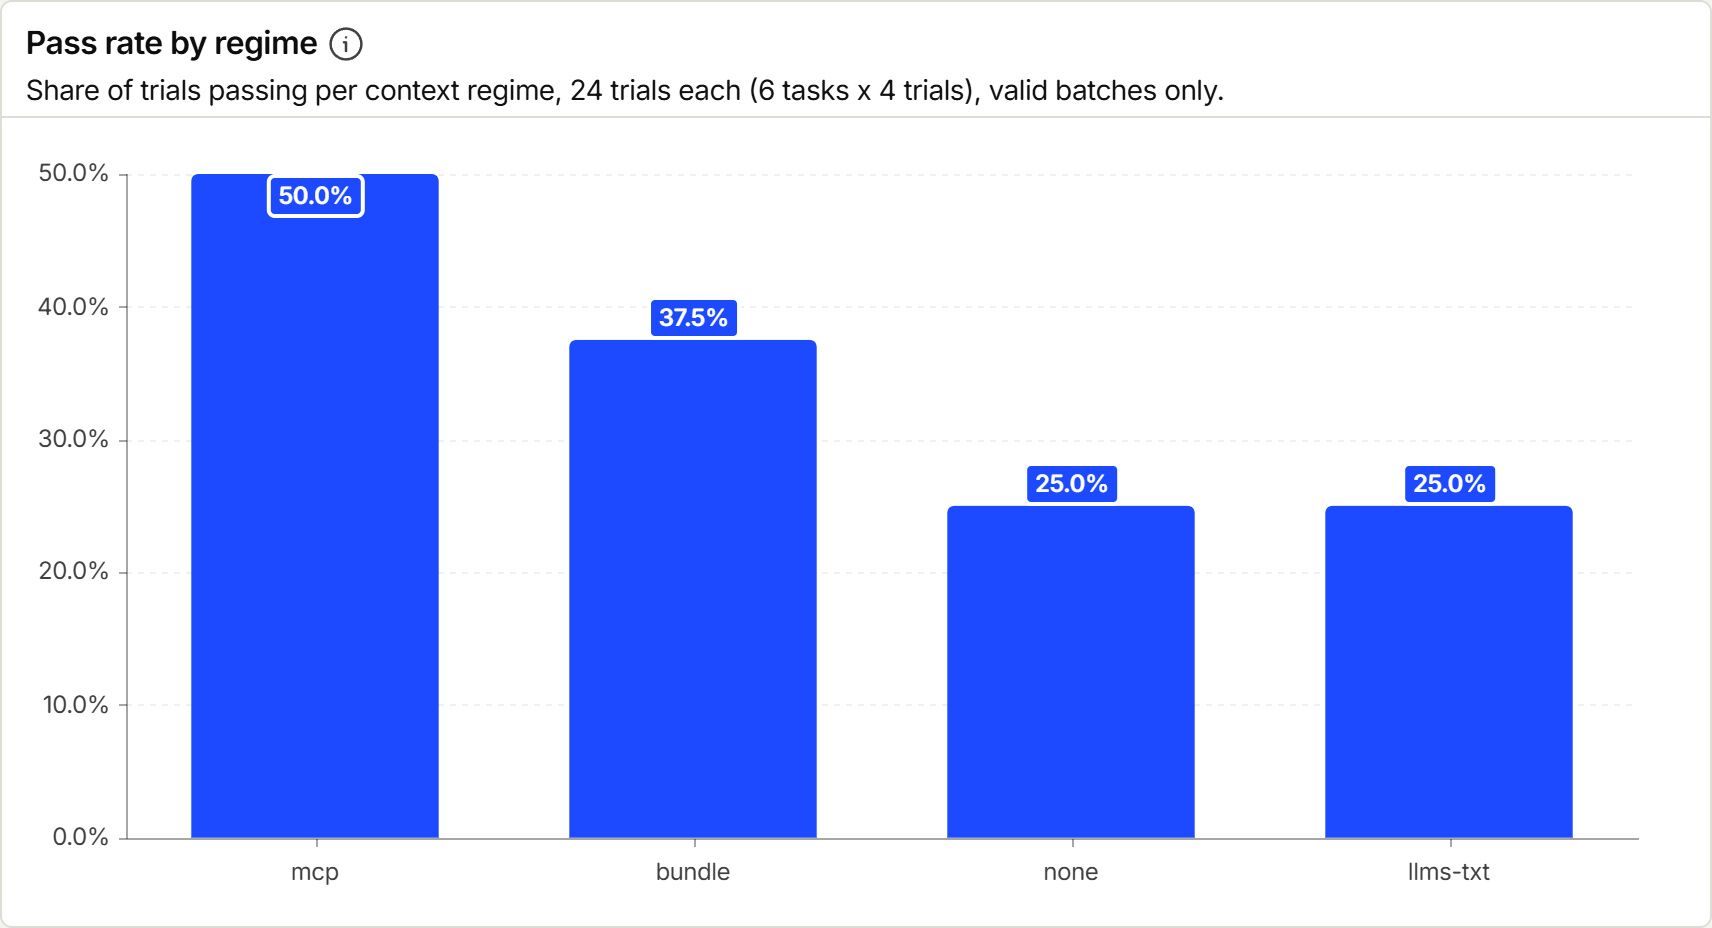
| Passes / 24 | 6 | 6 | 12 | 9 |
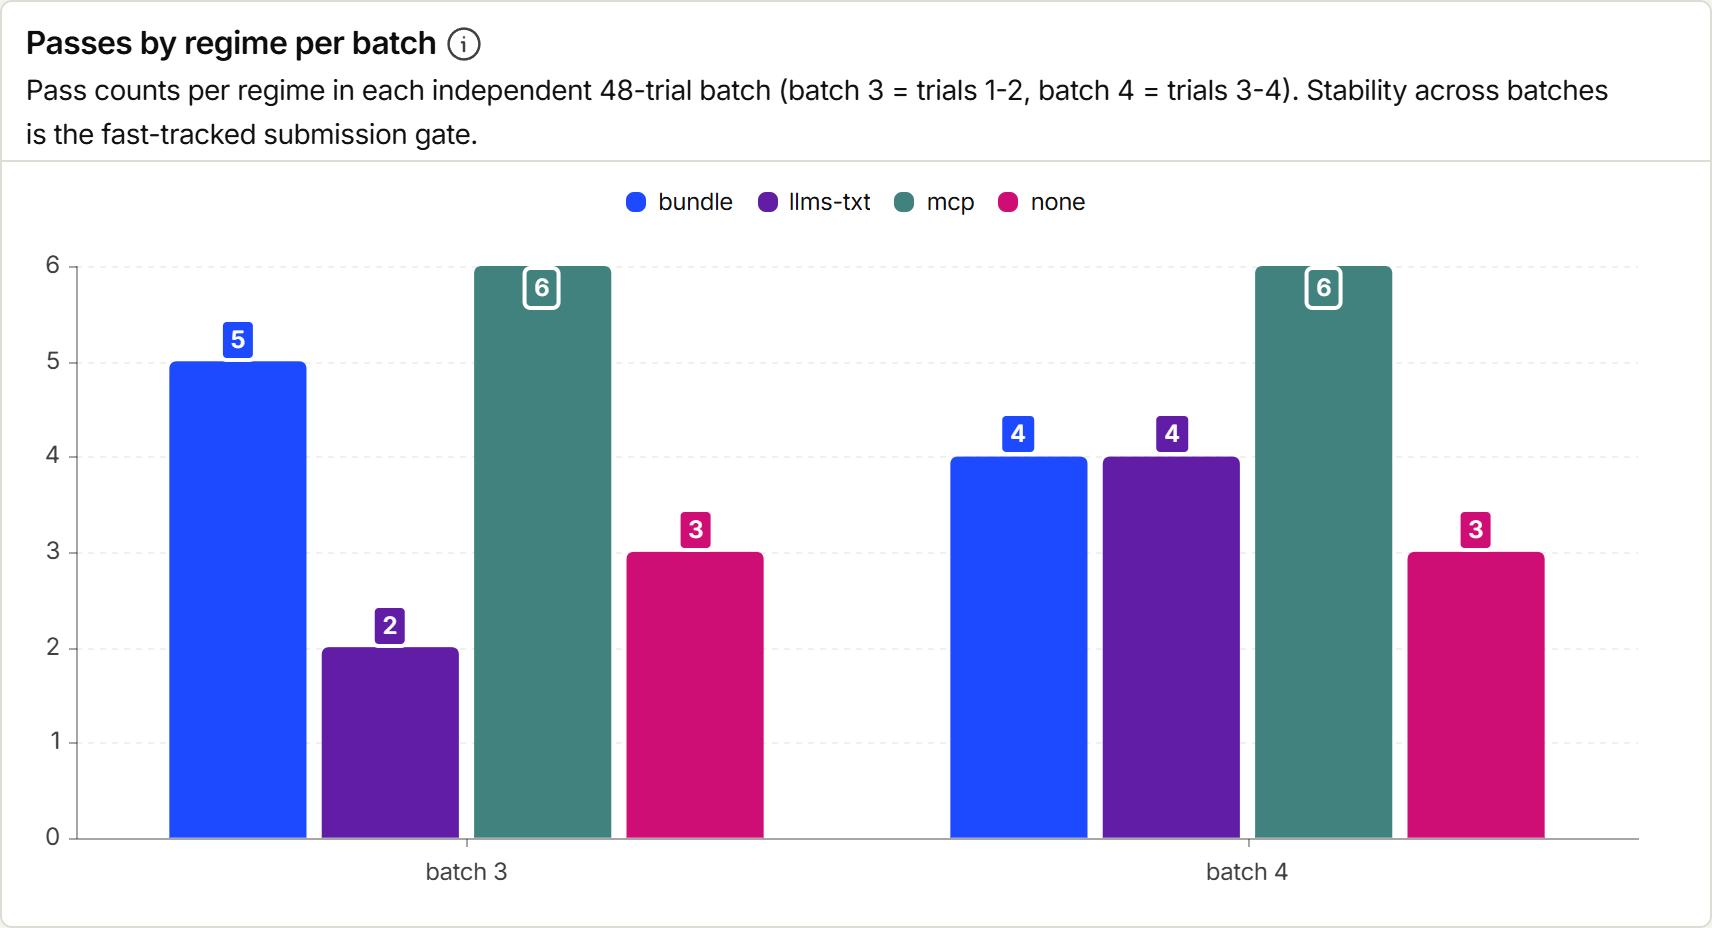
Cost per success by regime (cap-50 sonnet grid; total wall time 382 minutes, total cost $171.72 at API-equivalent pricing, since the runs actually rode a Claude subscription):
| Regime | Passes | Total cost | Mean cost/run | Cost per success |
|---|---|---|---|---|
| none | 6/24 | $28.73 | $1.20 | $4.79 |
| llms-txt | 6/24 | $82.27 | $3.43 | $13.71 |
| mcp | 12/24 | $31.20 | $1.30 | $2.60 |
| bundle | 9/24 | $29.52 | $1.23 | $3.28 |
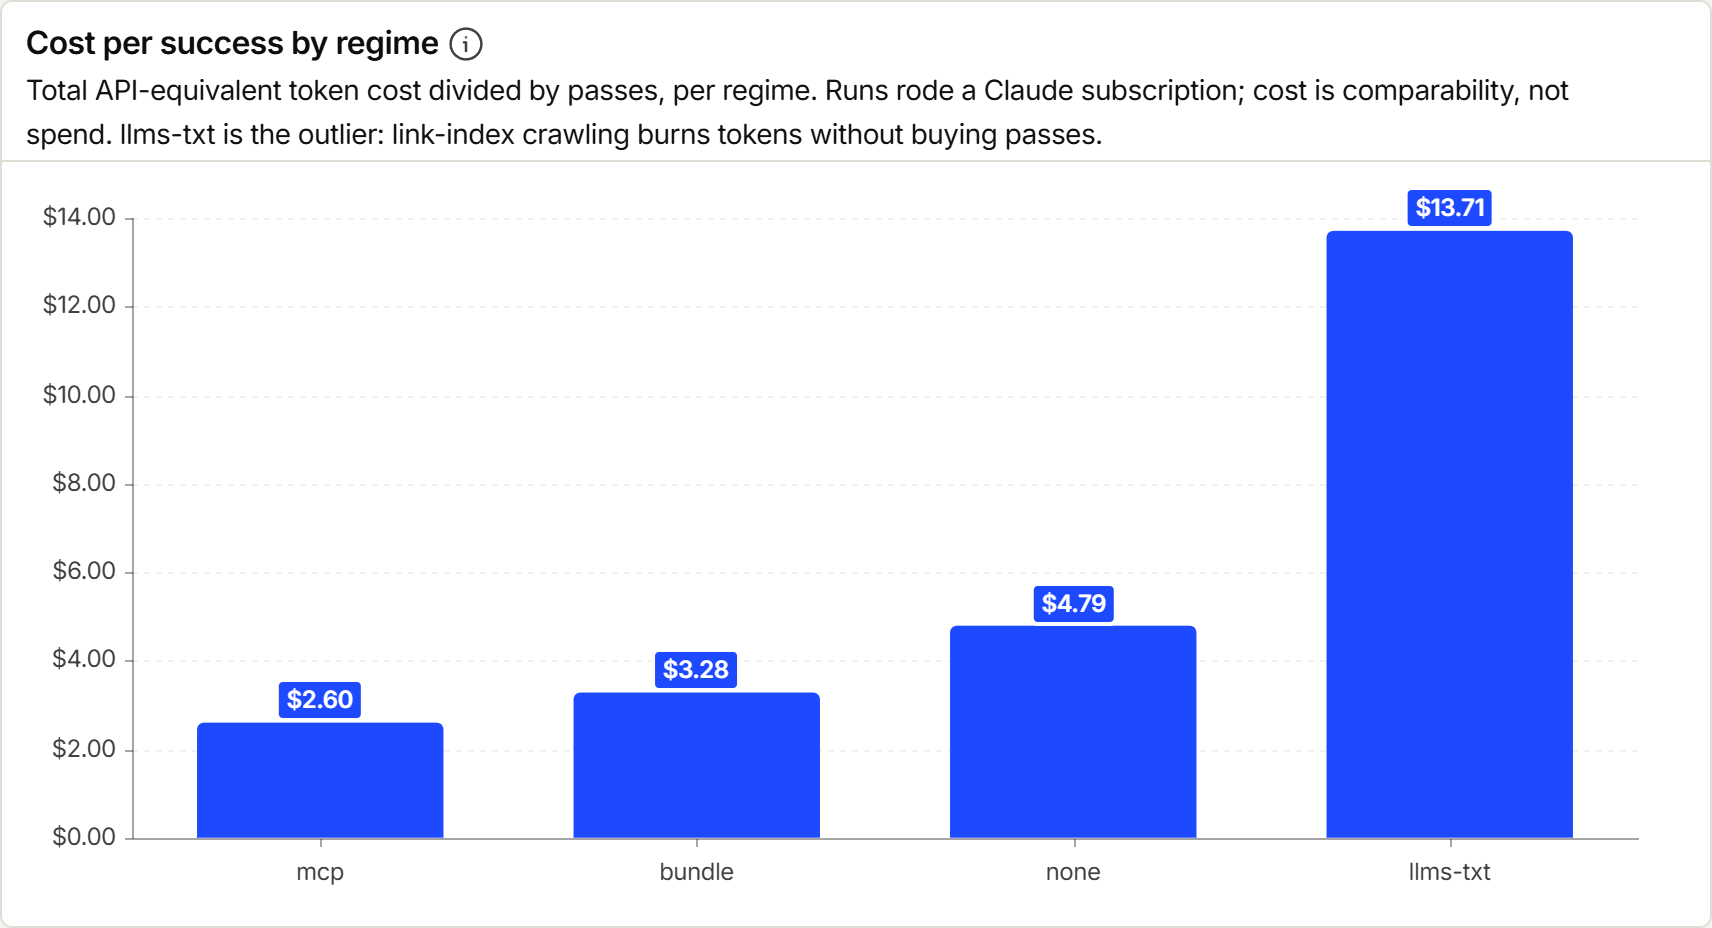
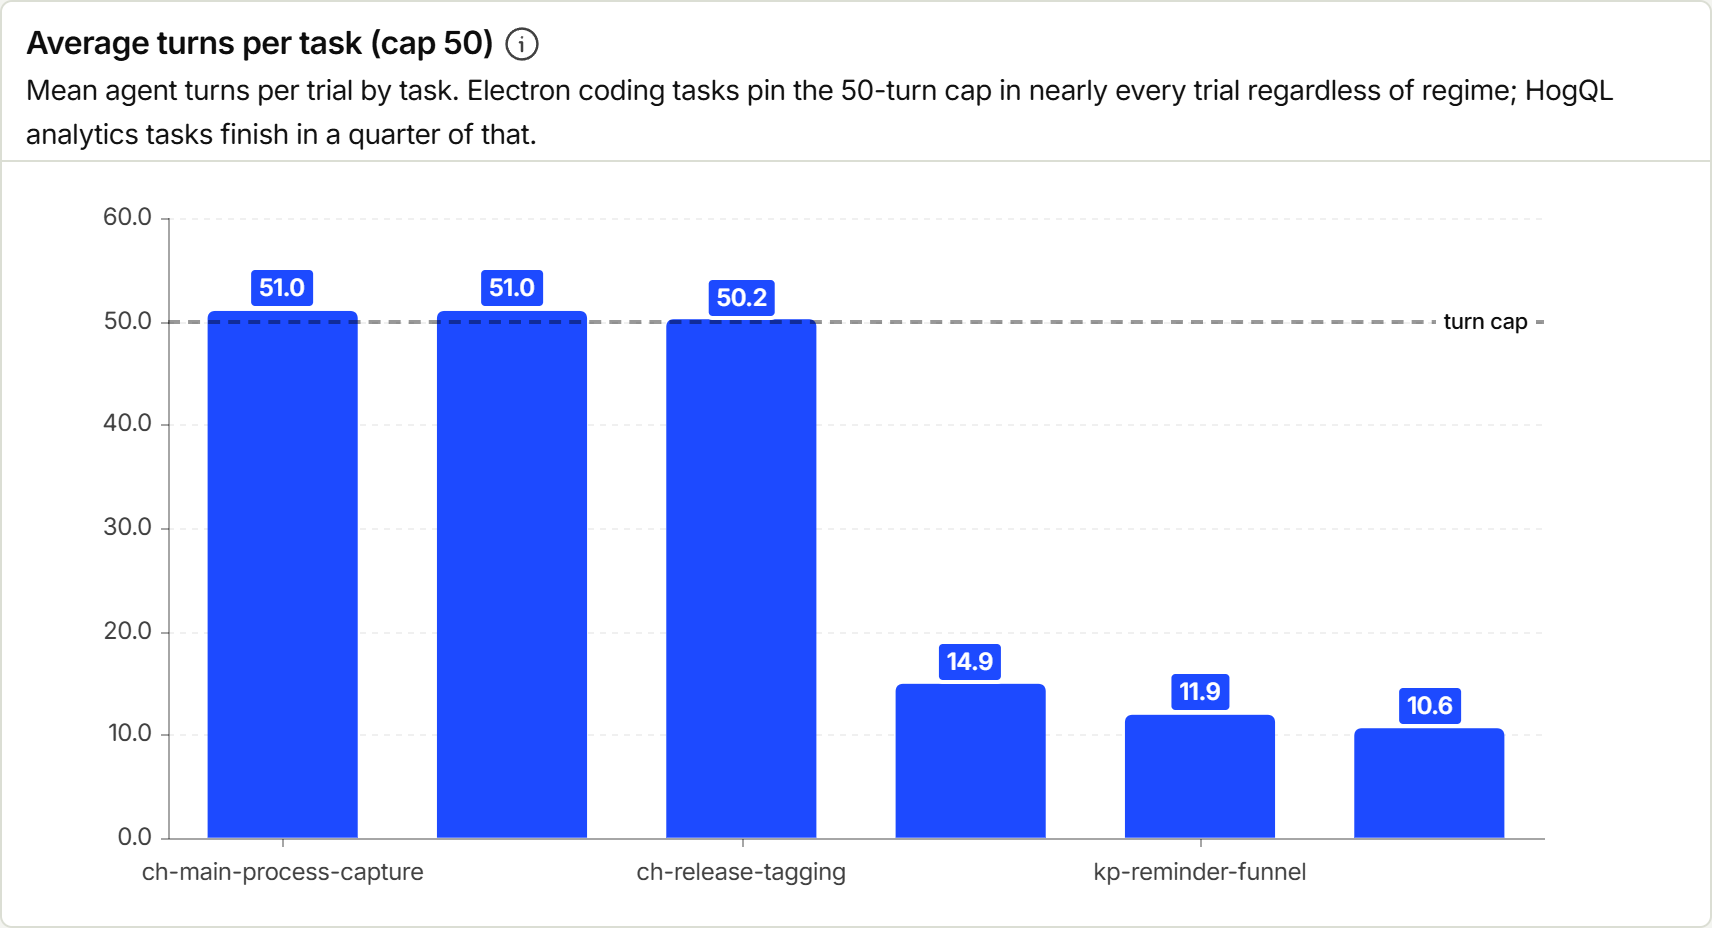
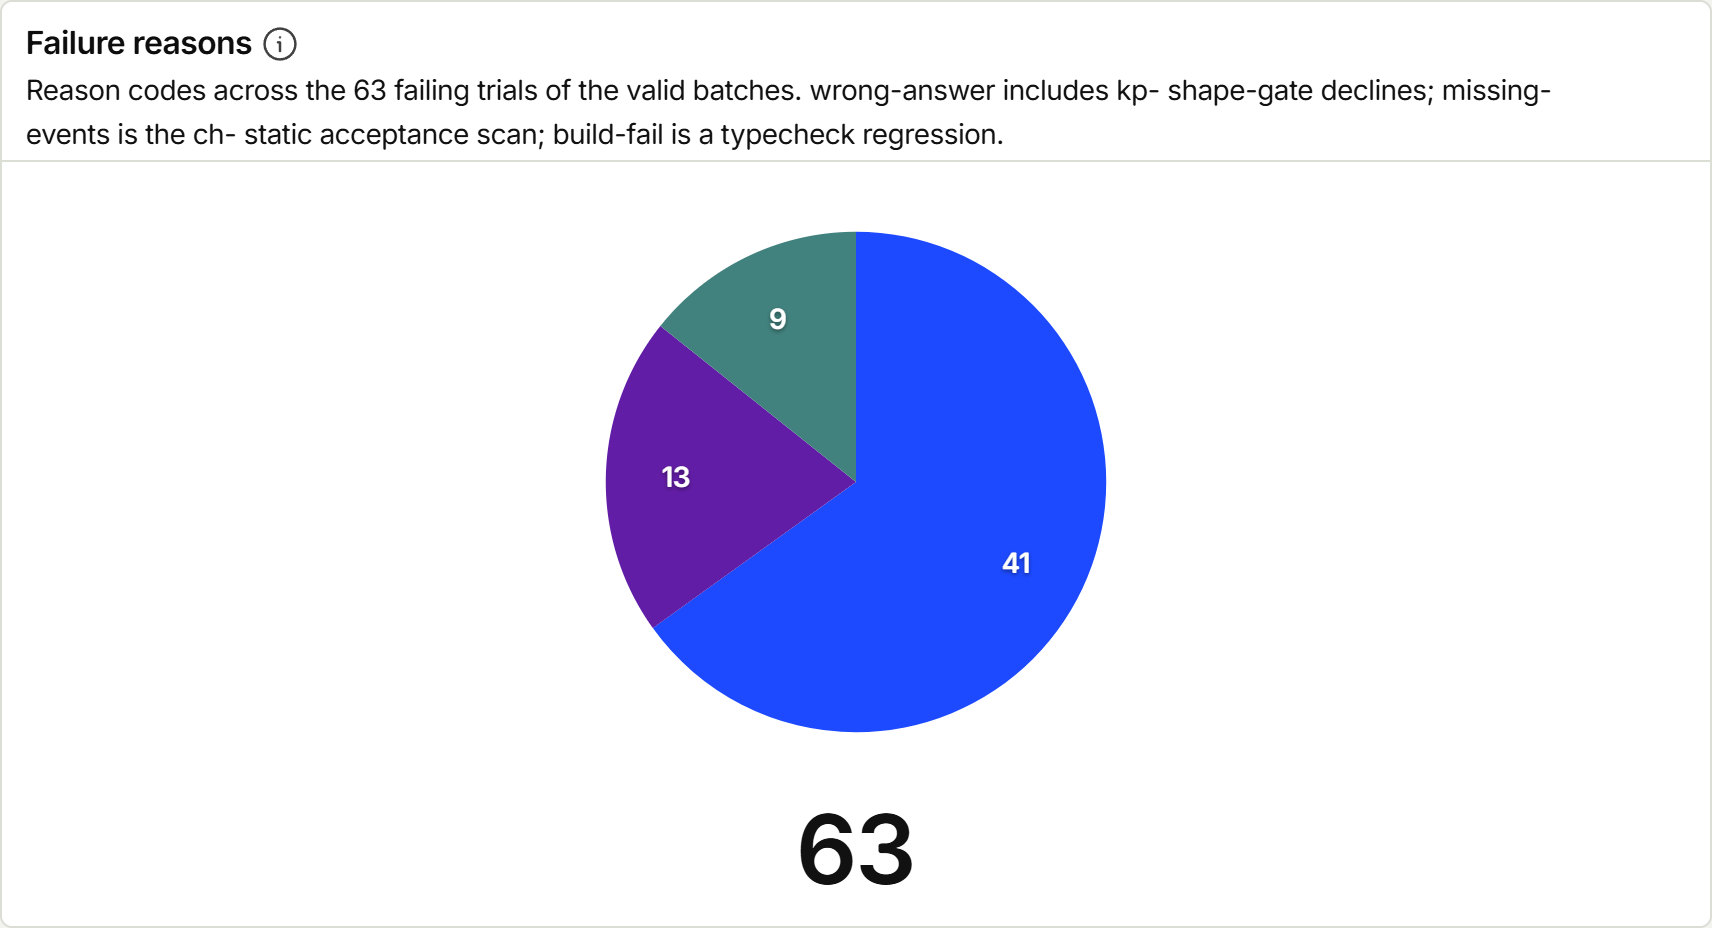
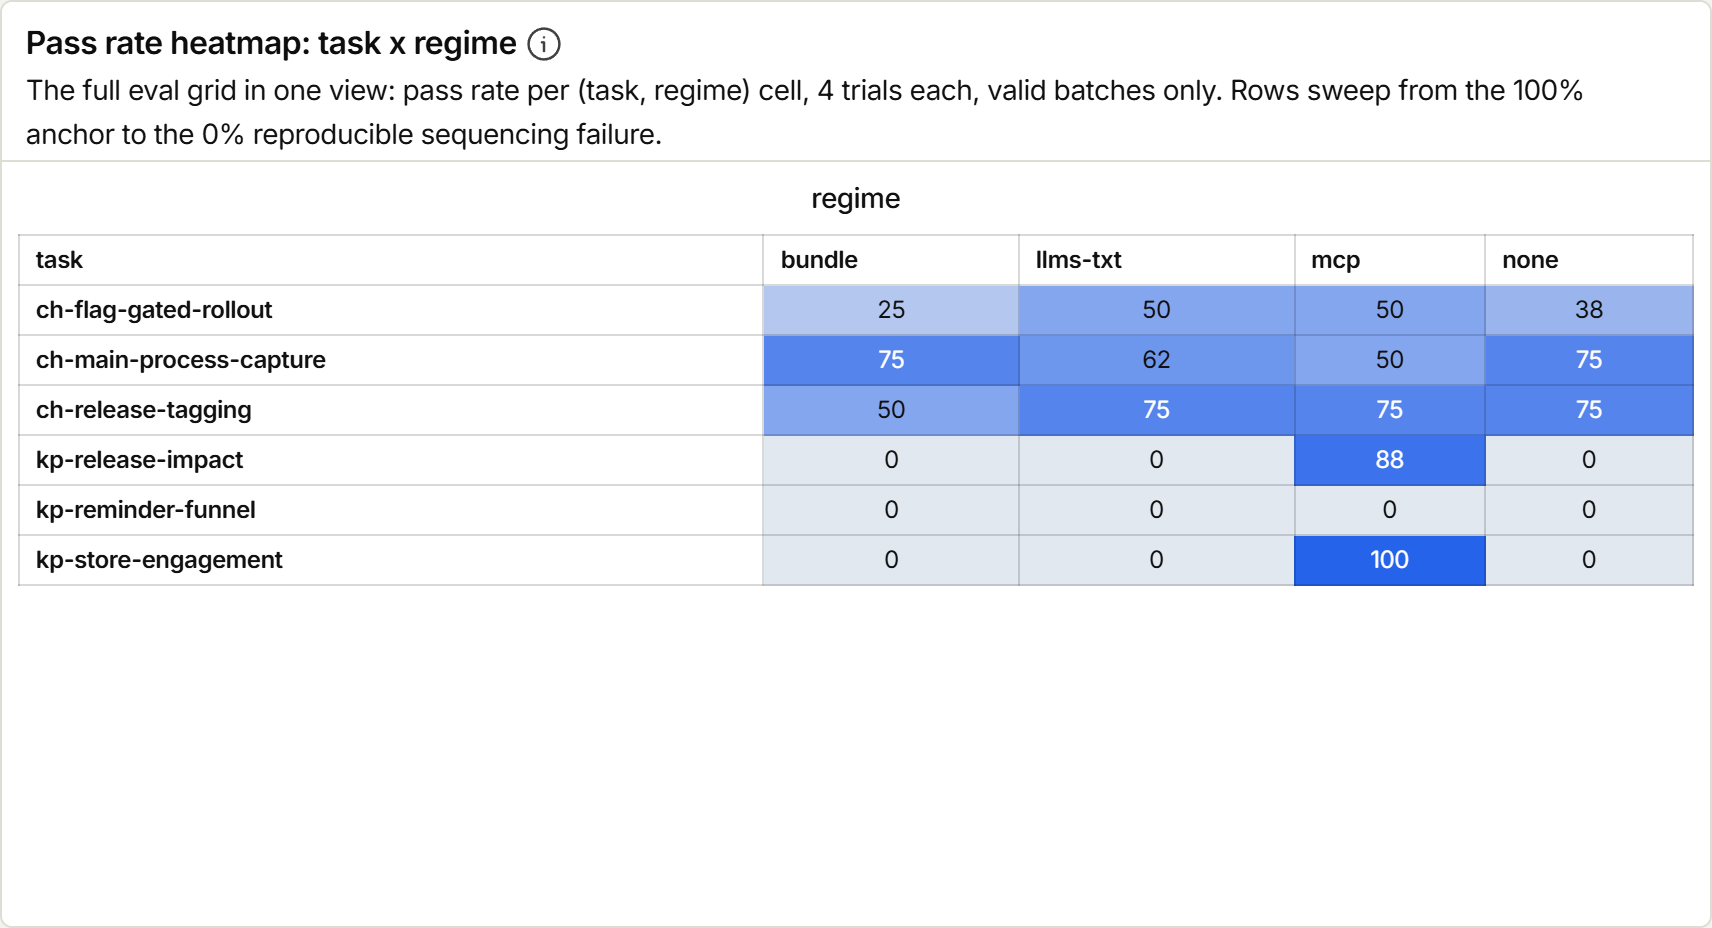
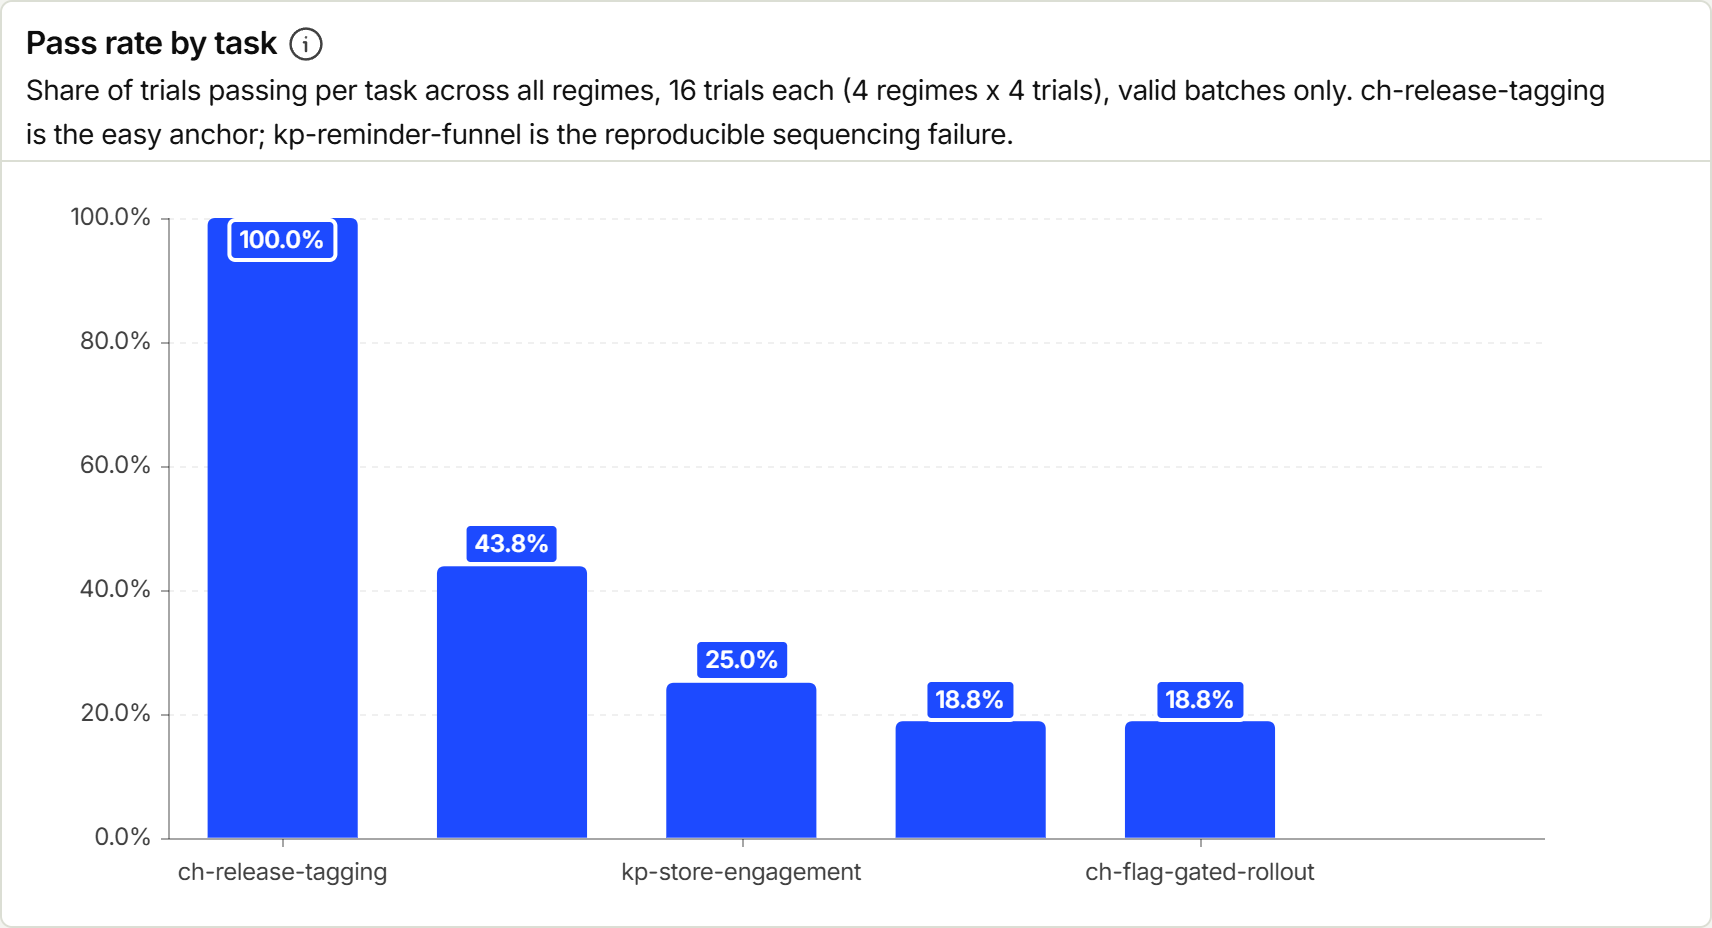
The charts are live captures of the results dashboard. All tiles except the heatmap are filtered to this sonnet grid’s two valid batches, so they match the tables above; the heatmap aggregates both cap-50 arms, eight trials per cell, which is why its percentages sit between the two models’ numbers. None of the tiles include the cap-1000 grid, since mixing two turn-cap regimes and two checker versions into one chart would misrepresent both. Three problems with this grid surfaced after publication.
The turn cap was the real bottleneck
45 of 48 ch- runs hit the 50-turn cap, which meant most coding-task failures could be starvation artifacts rather than real misses. A cap-100 sweep confirmed it: 39 of 40 addressable ch- failures at the 50-turn cap were turn starvation, not model failure. That is what justified the 1000-turn definitive grid (commit 081ba11), where zero rows capped and the same tasks ran 22 to 122 turns.
The consequence shows up directly in the numbers. At cap 50, bundle swept ch-main-process-capture 4/4 while every other regime managed 2 or fewer, which looked like a decisive curated-context win. Uncapped, all four regimes saturate it 8/8 on both models. And ch-flag-gated-rollout, which read as uniformly hard at cap 50, separates the models once starved runs stop polluting it: 3/8 sonnet against 5/8 opus.
The checker had bugs in both directions
Before spending compute on longer runs, I audited the scoring code, and ch-release-tagging’s checker failed the audit twice over.
- False negatives (fixed in
7d60acc): the checker required theregistercall and the release-property keys to appear in the same file’s added lines, which wrongly failed correct implementations that extracted super-properties into their own module. Its hardcoded-semver scan also misread test fixtures liketoHaveBeenCalledWith({ app_version: '0.9.7' })as production hardcoding. Sonnet had passed the task 16/16 writing everything inline in one file; opus had scored 6/16 writing extracted modules plus tests, and every opus failure the audit checked was a check artifact, not a real miss. The same commit added aturn-cappedreason code so budget artifacts stop contaminating failure-reason breakdowns. - False positives (fixed in
349d235plus three follow-ups): once the symbol search could follow the register call across files, release-tagging keys anywhere in the target file could wrongly credit a symbol that didn’t define them. The fix series scoped the search to the declaration’s own body and closed the correctness gaps that scoping introduced.
Under the corrected checker, opus reran the task at 5/8, with three of the eight failures being pure turn-capping. I don’t have a clean rescoring of the original 16 sonnet trials against the final checker, so treat the 16/16 row above as measured by a checker later shown to be buggy in both directions. Flagging that is more honest than quietly restating a number I can’t back.
A rate-limit bug scored empty runs as failures
Partway through the definitive grid, the account hit its weekly Claude usage limit. claude -p invocations started returning instantly with zero gross tokens, never reaching the model, and the runner scored each untouched workspace exactly as if the agent had tried and failed. A rate-limit rejection was indistinguishable from a genuine wrong answer. This poisoned 55 rows before it was caught.
The fix (commits 42e3fba, b2a5a84) detects zero-gross-token runs before scoring and journals them as rate-limited errors, excluded from all pass rates and always rerun on resume. Every poisoned cell was rerun after the fix; the pre-fix rows are preserved in journal.jsonl.bak files for auditability, and the detection went on to correctly catch 33 more genuine rate-limit rejections as the grid finished. An eval harness needs the same defensive posture as production code: an infrastructure failure and a real failure produce different-looking evidence, and conflating them biases every number downstream, always in a direction you won’t notice.
Findings
1. Live data access is necessary, and nearly sufficient, for analytics tasks. Nine of nine analytics passes in the definitive grid, and seven of eight on the winnable tasks in the original grid, came under mcp. Every documentation-only regime went zero across the board, and the failure mode matters as much as the rate: those trials died at the answer-shape gate rather than producing well-formed wrong numbers. No amount of documentation lets an agent report “809 events and 8.71 average DAU the week before release, 520 and 6.86 the week after” without a connection to the data.
2. The sharpest finding is an MCP failure: a reproducible documentation gap in sequential funnels. On kp-reminder-funnel, all four cap-50 mcp trials independently computed a conversion rate of 0.5 against a true 0.1667, by the identical shortcut: counting users who fired both reminder_created and habit_confirmed anywhere in the window, instead of users whose first habit_confirmed came at or after their first reminder_created, which the prompt explicitly asked for. That is “did A and B” standing in for “did A then B,” and I could not find a worked sequential-funnel HogQL example anywhere in PostHog’s public docs.
The definitive grid sharpened this rather than overturning it. One sonnet trial got the sequencing right unprompted in 17 turns; its sibling reproduced the exact 0.5 shortcut on a fresh long run. (Both opus trials were rejected by the checker’s read-only HogQL guard before producing a comparable number; no transcript survives to adjudicate whether that guard fired correctly, and the MCP key was read-only and project-pinned regardless.) So the gap is real and reproduces most of the time, but it is not structurally unreachable: the correct pattern is attainable from the same context. That makes “a worked example would close this” a stronger claim with one clean pass in hand than it was with zero.
3. Curated context buys turns, and turns are money; it does not buy capability the model lacks. The bundle sweep of the Electron crash-capture task at cap 50 was real, but what it measured was efficiency: with a hand-scoped bundle composing renderer-side error APIs with a preload/IPC bridge (which no public PostHog doc covers), the agent finished inside 50 turns; without it, the same models needed room to grind (ch- runs averaged 77 turns uncapped) and then also succeeded. Turn count drives cost on these tasks, so the Electron docs gap still costs real money on every run even when the agent eventually gets there. Context quality is a cost lever everywhere and a capability lever only where the turn budget is binding.
4. llms.txt bought no lift at the highest cost. It tied none on passes in the cap-50 grid (6/24 each), tied it again in the definitive grid (10 passes each across both models), and cost $3.43 per run against none’s $1.20, the worst cost per success of any regime. The snapshot is a ~330 KB flat link index, so an agent burns turns crawling it one WebFetch at a time before it can act, and that overhead never converted into task-relevant depth. This is a design problem with the artifact: a link index optimized for a human skimming titles fits an agent worse than either no context or a small task-scoped bundle.
5. Context that describes data without connecting to it is a fabrication risk. In the excluded early batches, one bundle trial confidently fabricated plausible-looking analytics numbers, and another passed by quietly querying production through inherited credentials. After credential isolation, every documentation-only trial on every analytics task either declined honestly or was caught by the reference check. Prose doesn’t catch fabrication; a live reference check does.
Learnings
What this study taught me that transfers past these six tasks:
- Connection beats description. Wherever data was the deliverable, live access was the only thing that worked, and description without connection enabled confident fabrication.
- Fit beats volume, and both interact with budget. A small hand-scoped bundle beat a 330 KB index on cost everywhere and on passes exactly where the turn budget was tight. What counts is how much of the context an agent can actually spend in the turns it has.
- Grade the graders. The single largest correction in this study came from auditing my own checker, not from running more trials. Checker bugs are invisible from the pass-rate tables they corrupt.
- Reproducible failures are the highest-value output. Four trials converging on the same wrong number is a documentation bug with an address. A flaky miss teaches nothing.
- Distrust mid-range effects at small n. Doubling n dissolved one apparent regime effect; removing the turn cap dissolved another. Floors and ceilings are cheap to establish. The middle is not.
- Harness bugs bias optimistic or bias silently. Inherited credentials and fabricated numbers inflated early scores; the rate-limit bug deflated later ones while looking exactly like real failures. Credential isolation, infra-vs-failure discrimination, and live reference checks belong in the eval design from the start.
Methods hardening
The parts that took the most iteration:
| Problem | Fix |
|---|---|
| Multi-turn runs re-read cached context every turn, so gross token counts inflate 20-50x over real spend (measured: 30.5x overall) | Budget guard caps noncached tokens per run (input + cache-creation + output), so the cap tracks real spend instead of turn count |
Headless claude -p would silently skip connecting to the PostHog MCP server |
Server entry must declare "type": "http" and must not be named posthog (Claude Code caches a needs-auth verdict per server name, so colliding with a developer’s own OAuth-based server skips auth); every run passes --strict-mcp-config so no ambient user-scoped MCP server leaks in |
A none/llms-txt/bundle run must never query live PostHog with harness credentials |
All harness PostHog environment variables are stripped from the agent subprocess in every regime; the mcp token travels through a generated config file outside the workspace, deleted at teardown, never as an env var |
The mcp regime must not touch production data destructively or leak into the wrong project |
Read-only API key; every task pins the MCP session to one project via header (kp- to Keeplings production, ch- to a scratch project); a missing token or project id fails the cell as check-infra rather than running unpinned |
The two largest fixes, the checker audit and the rate-limit discrimination, are covered in their own sections above.
Limitations
- Small n. n=4 in the original grid, n=2 in the definitive one. Powers floors, ceilings, and directional sweeps, not mid-range comparisons.
- One model family. Both models are Anthropic’s; nothing here tests whether the regime effects generalize across providers.
- Six tasks. Real work from two apps, not a stratified sample of PostHog use cases.
- Static acceptance on
ch-tasks. Live event-arrival validation happens manually once each feature actually lands; no task asks the agent to run the app. - Cost is API-equivalent, not actual spend. The runs used a Claude subscription; per-token pricing is applied for comparability. The cost table covers the cap-50 sonnet grid; I did not compute a comparable table for the definitive grid.
- The original
ch-release-taggingrow was measured by a since-fixed checker, and the charts capture the cap-50 batches only.
Next steps
Concrete actions this data supports.
For PostHog’s docs:
- Ship a worked “did A then B” sequential-funnel HogQL recipe, ideally reachable from the MCP server’s own tool descriptions. Finding 2 is the case: nearly every funnel trial took the same “did A and B” shortcut, and the one clean pass shows the correct pattern is reachable from existing context once it’s made visible.
- Write Electron main-process integration guidance. The JS SDK docs are renderer-first; nothing public covers bridging flag evaluation or error capture across a preload/IPC boundary into a Node-side main process. Any Electron app using PostHog hits that assumption, and finding 3 prices the gap: agents get there eventually, at the cost of long runs.
- Restructure
llms.txtwith lightweight per-page summaries or task-class-scoped sub-indexes, so an agent can judge relevance before spending aWebFetchturn per candidate page. That per-page crawl is the bottleneck the cost data points at.
For this eval:
- Re-run
kp-reminder-funnelafter any doc fix to confirm the 0.5 shortcut actually disappears. A reproducible failure is only valuable if you close the loop. - Add a second model family (non-Anthropic) to separate regime effects from family quirks.
- Raise n to 8+ on the mid-range cells before claiming regime effects there; this study dissolved two apparent effects by raising n and removing the cap.
- Retain full transcripts for guard-rejected trials, so a fired safety check can be adjudicated as genuine or as a checker false positive instead of staying ambiguous.
- Validate
ch-passes against live event arrival once the real features ship, replacing static acceptance.
Results dashboard
Every trial fires an eval_run_completed event into a PostHog project as it is scored, so the results of this study live in PostHog itself: each chart above is a capture of a dashboard tile, each tile a HogQL insight over the captured events. The dashboard is publicly shared if you want the live version.
Reproduction
The full harness, task definitions, prompts, references, and raw data live in the public repo at github.com/johncwaters/claude-setup: the harness README under evals/, task definitions in evals/tasks/, and one append-only journal row per trial. evals/results/journal.jsonl holds the two cap-50 grids (192 rows), evals/results/checkfix-opus/ the corrected-checker rerun, evals/results/capsweep-*/ the cap sweeps, and evals/results/cap1000-*/ the definitive grid, pre-fix poisoned rows preserved in .bak journals.